
Blog
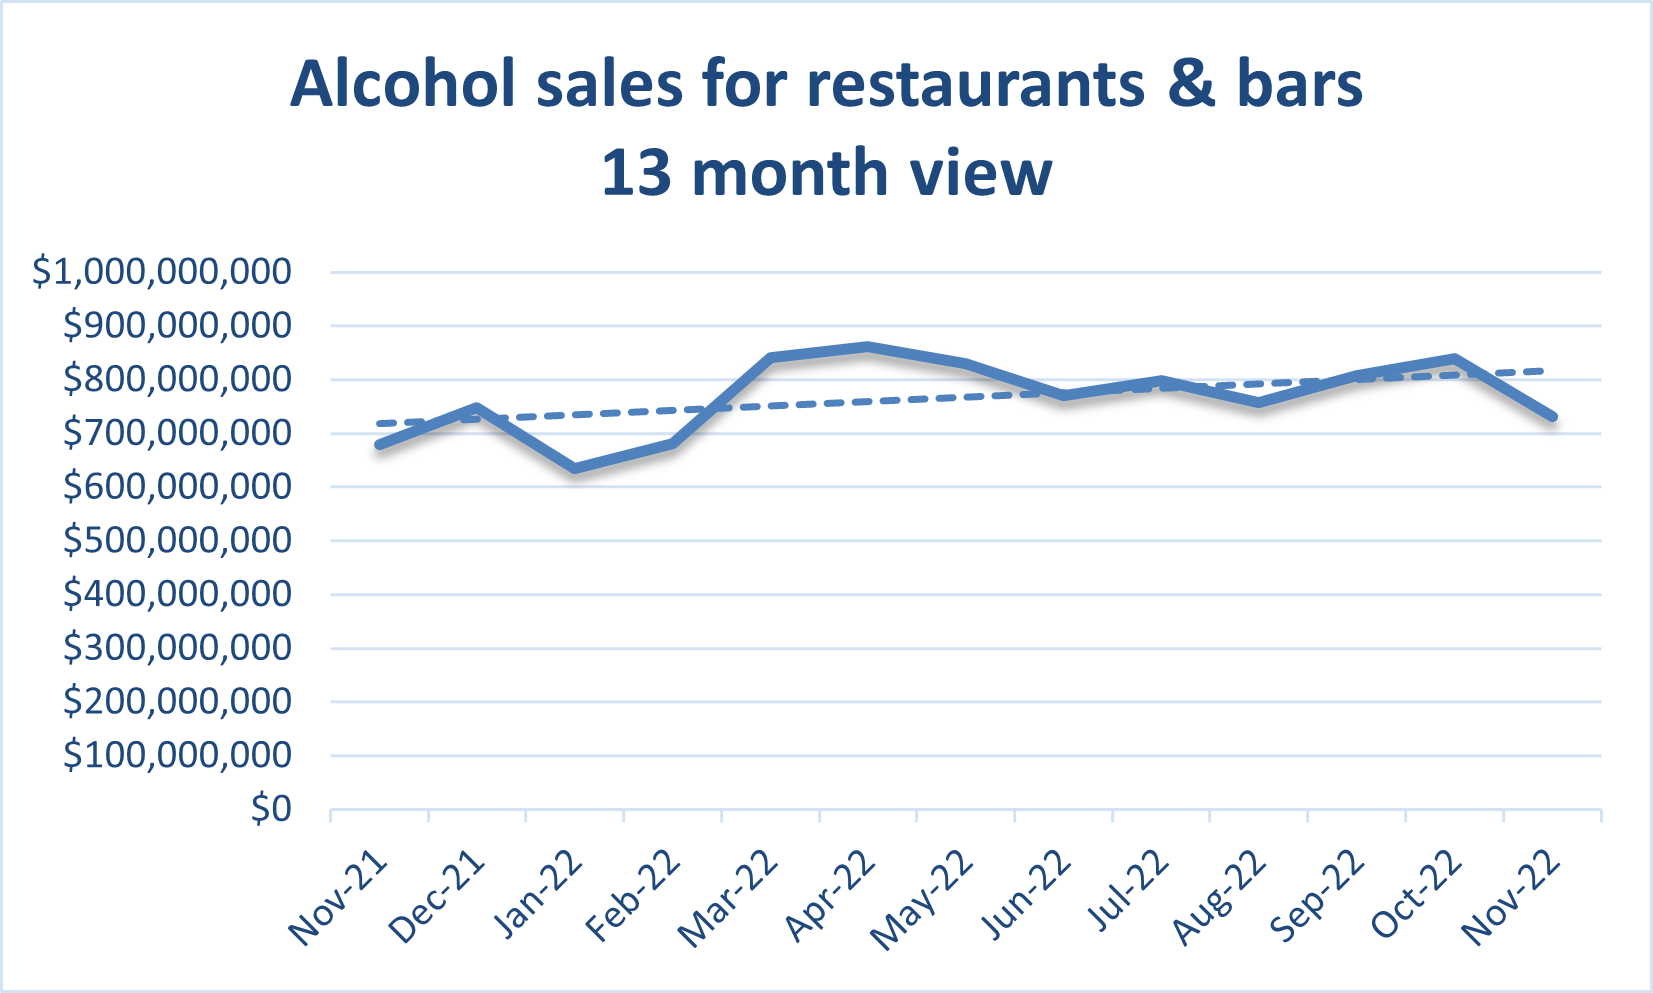
Top Restaurants & Bars for November
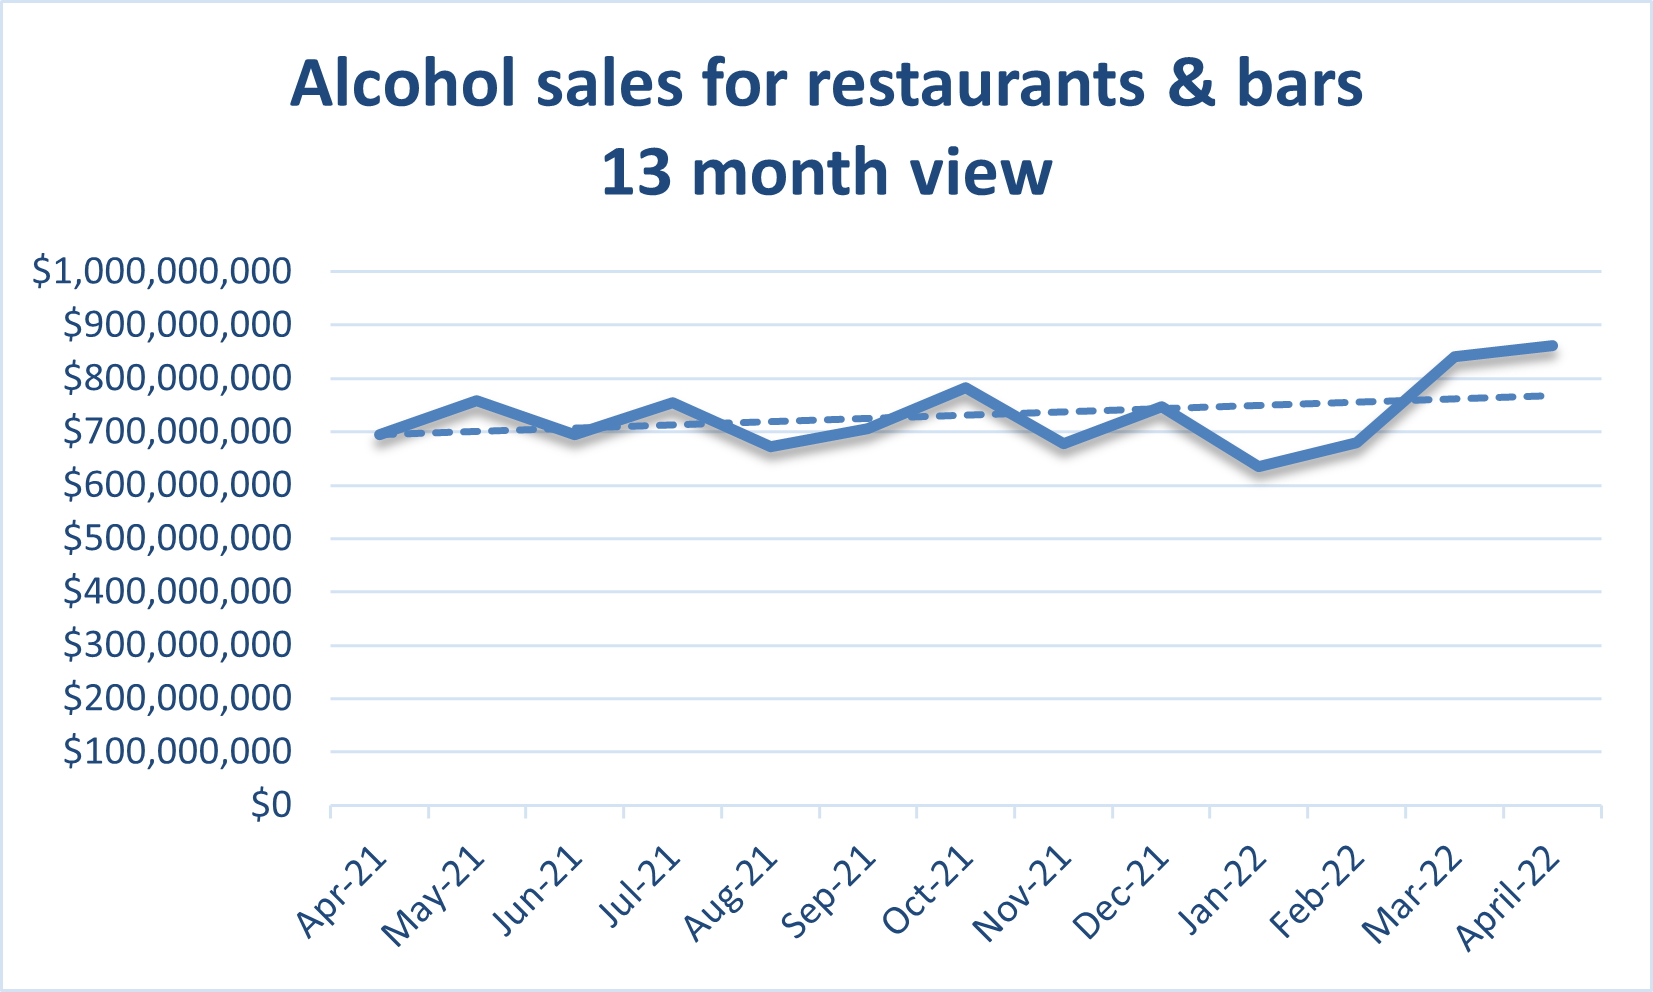
Alcohol sales for the month of November dropped 17% from October. To...
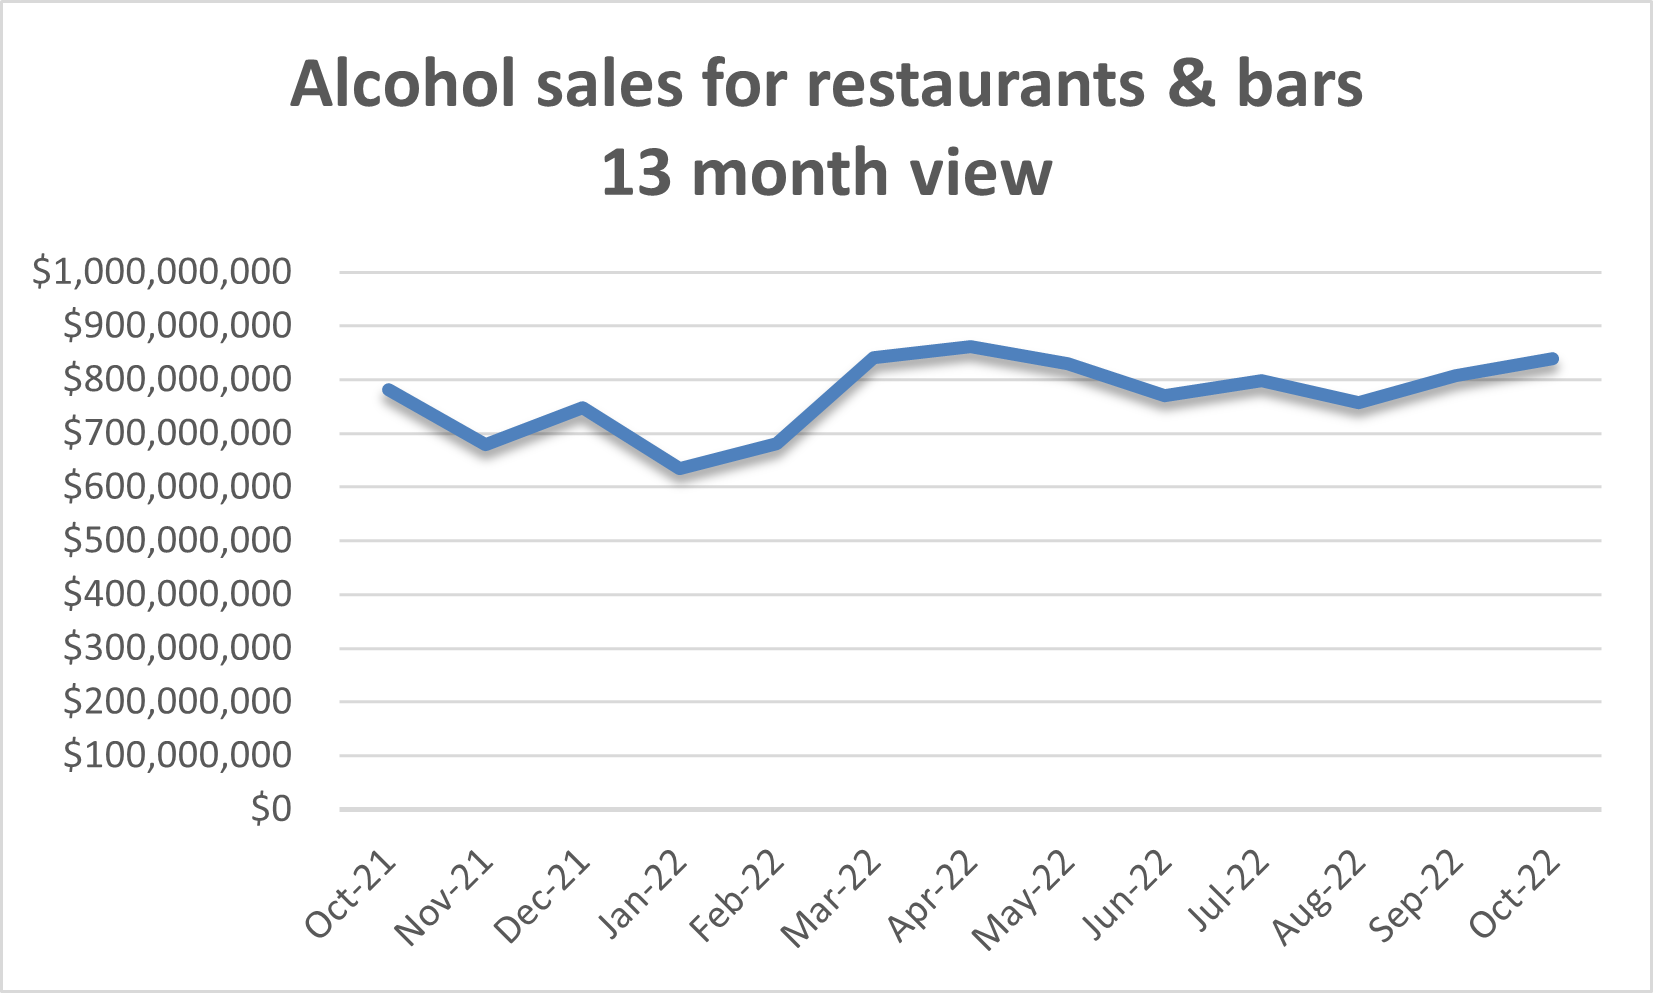
Top restaurants & bars for October
Alcohol sales for the month of October were up 3% from September....
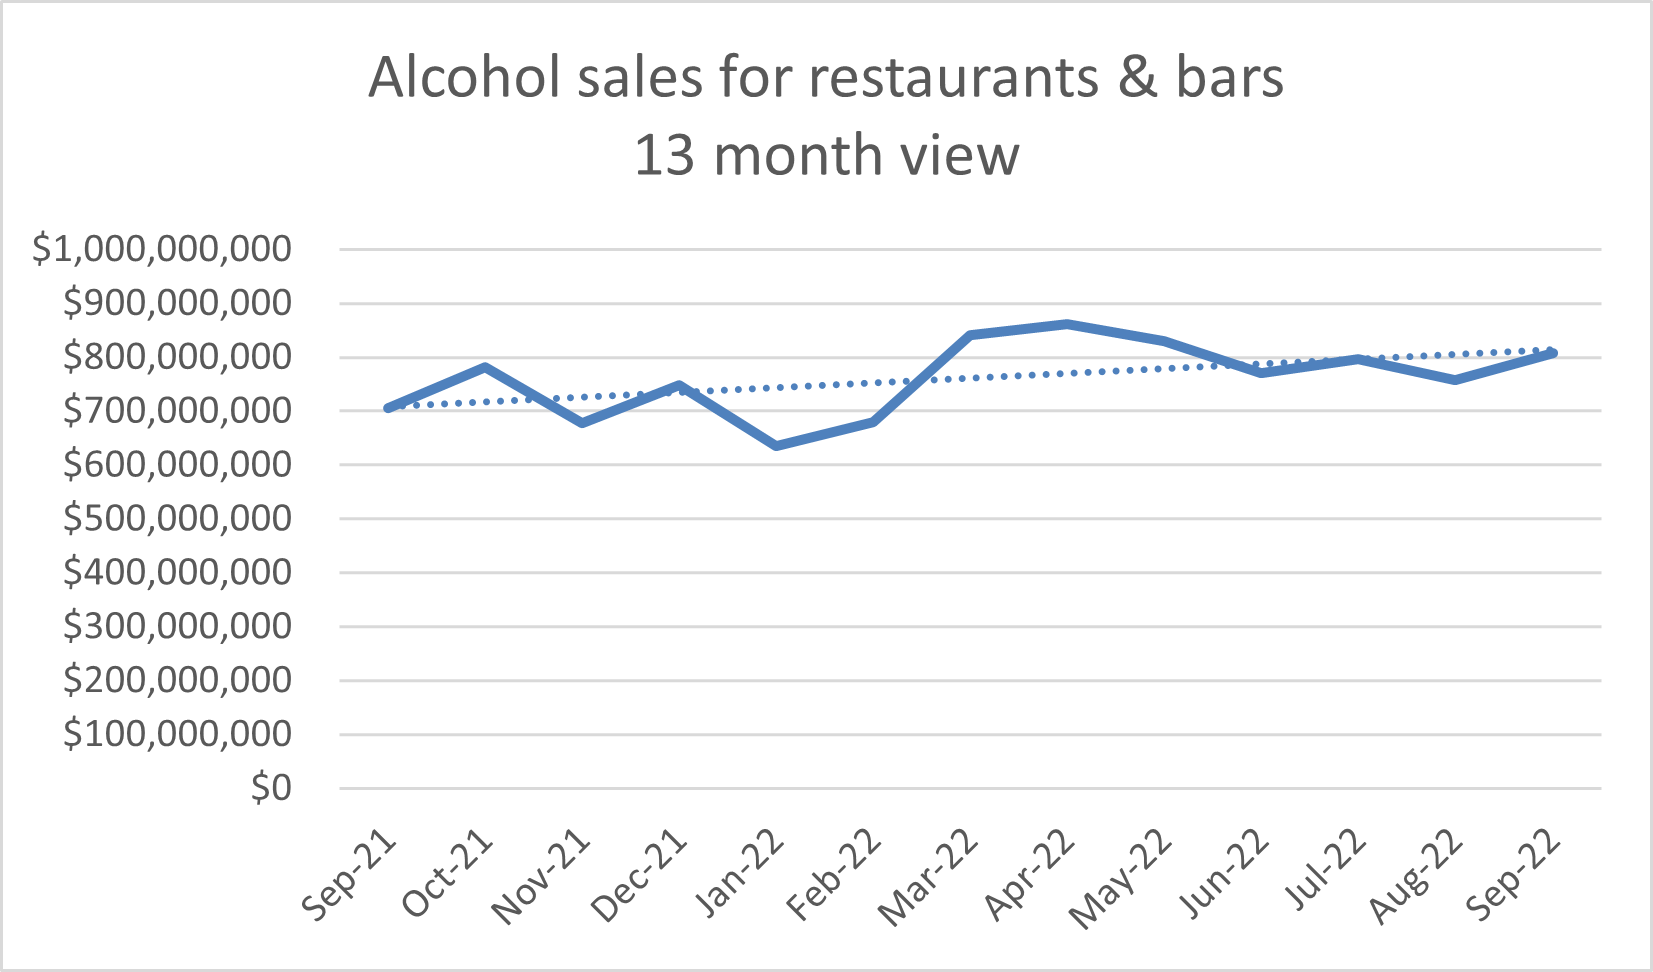
Top restaurants & bars for September
Alcohol sales for the month of September were up 7% from August....
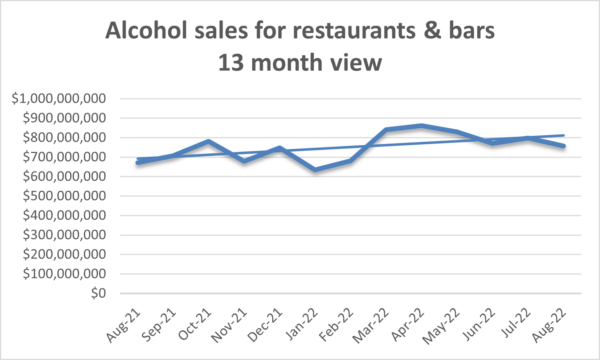
Top restaurants & bars for August
Alcohol sales for the month of August were down 8% from July....
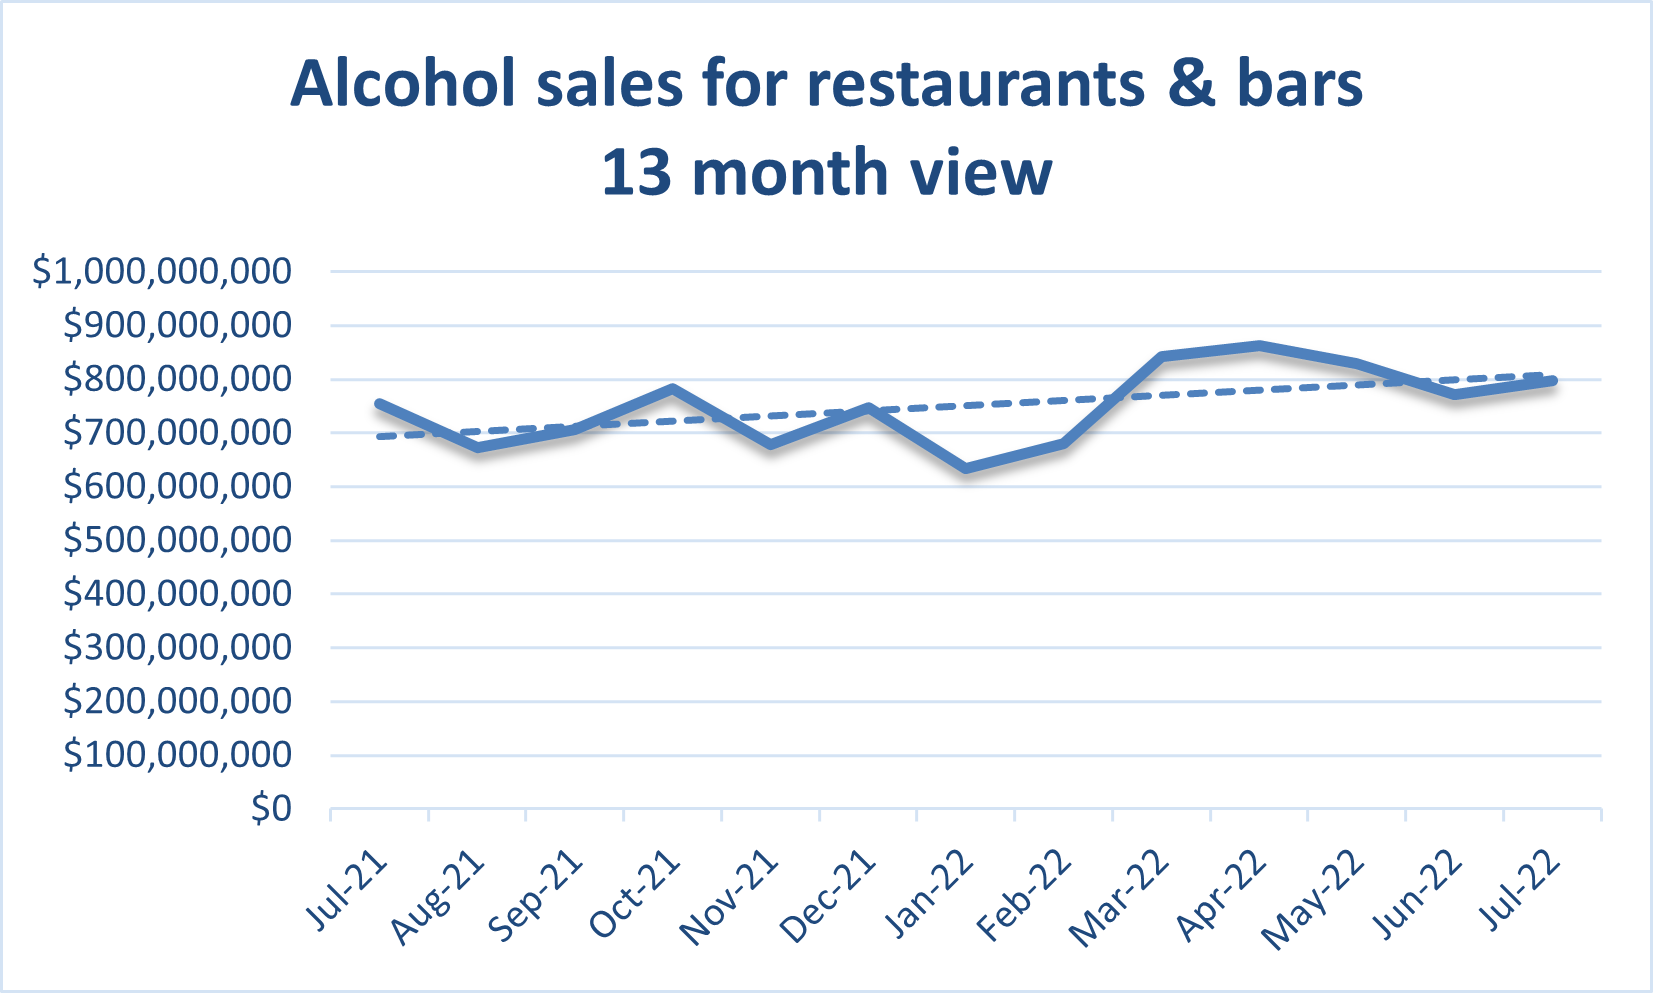
Top restaurants & bars for July
Alcohol sales for the month of July were down 1% from June...
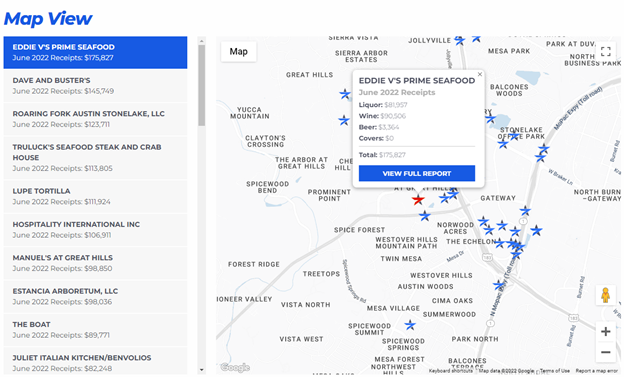
New Map view Feature
View all searches using an interactive map-based view With “Map View”, you...
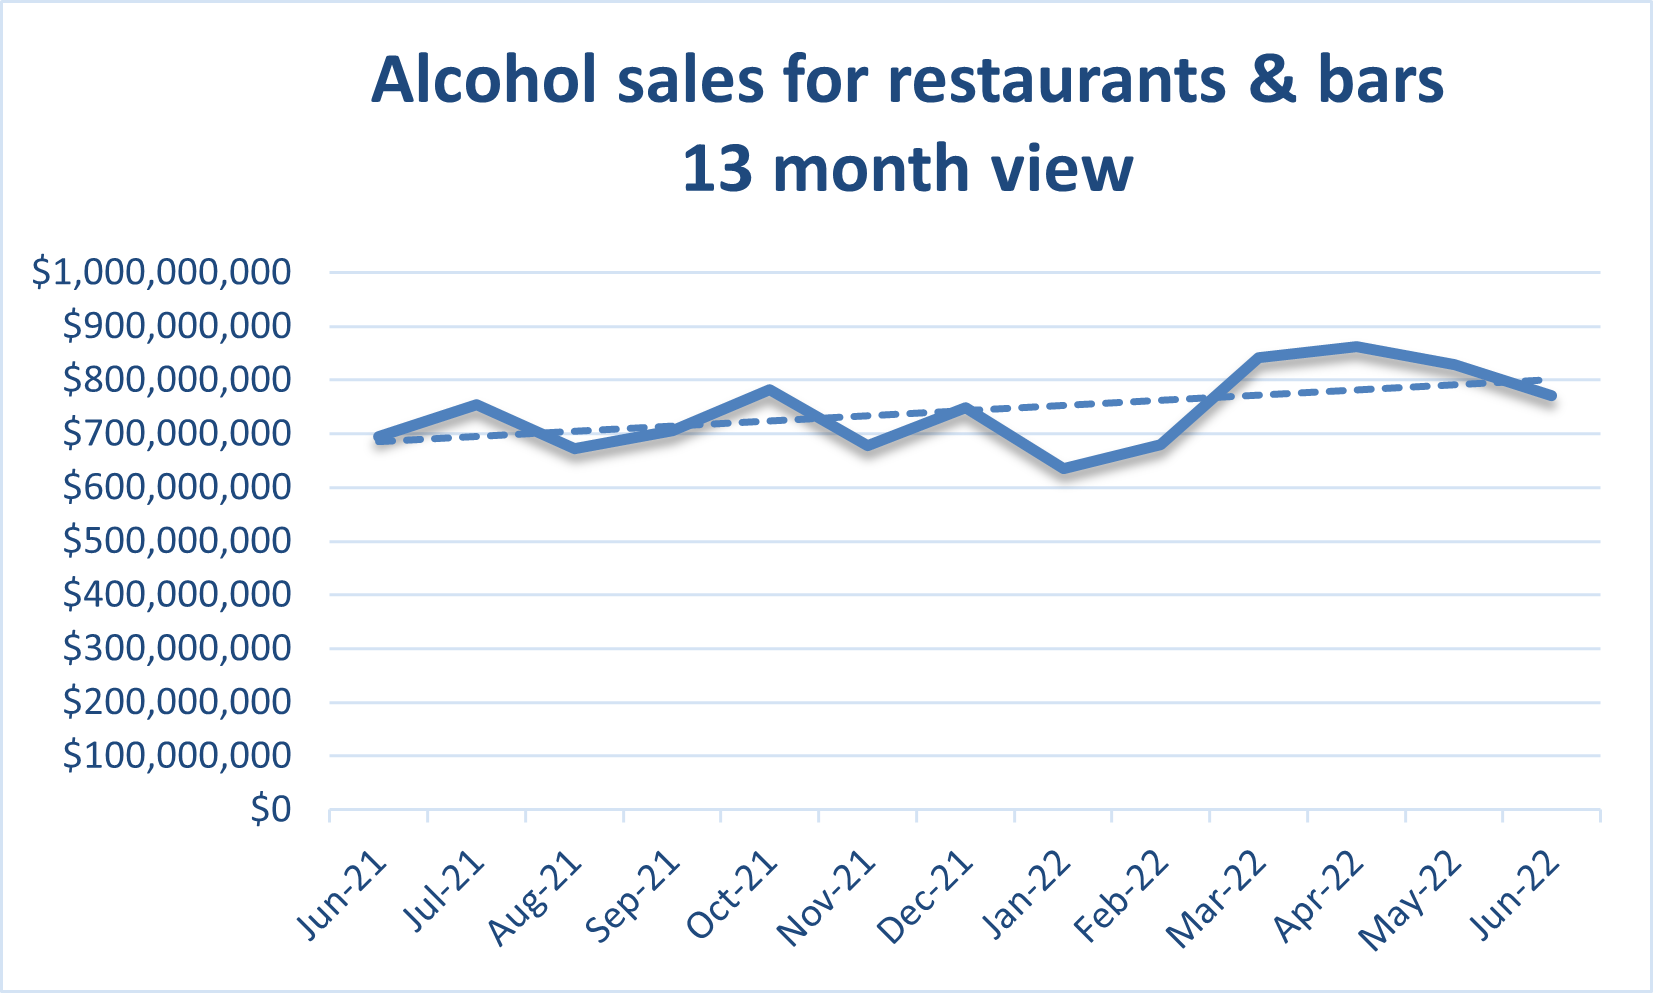
Top restaurants and bars in June
Alcohol sales in June were down 10% from May. To see liquor,...
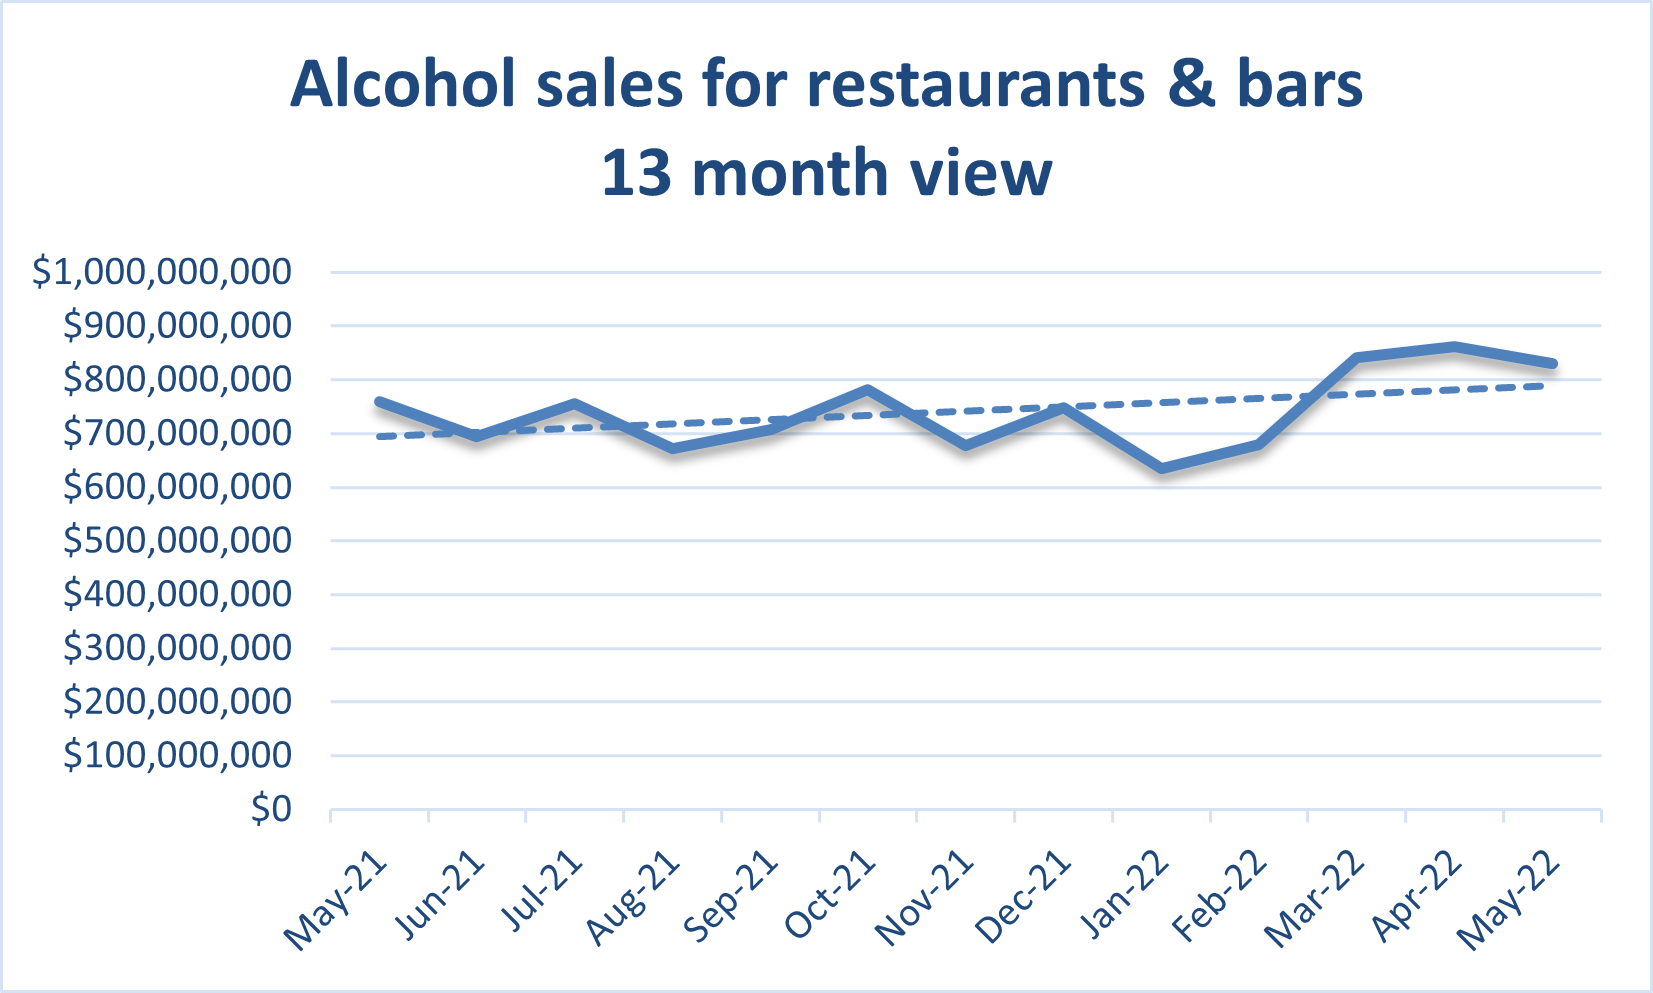
Top restaurants and bars for May
Alcohol sales for the month of May were down 6.74% from April....
Top restaurants and bars for April
Alcohol sales for the month of April were up 2% from March....
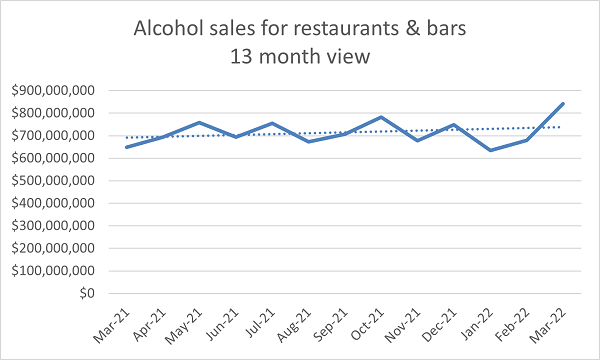
Top restaurants and bars for March
Alcohol sales for the month of March were up 24% from February....